For an interactive/embedded version of this report in Notion, please visit here.
Introduction
Following on from last week’s analysis of Margin Trading on GMX and Perp v2, you may have expected some continuation. Unfortunately, Increment’s powerful DEX table hasn’t yet indexed Uniswap V3 pools. Therefore, I’m flipping this analysis completely — as well as Margin Trading, GMX also offers swaps, with their biggest competitor on Avalanche being the native Uniswap V2 fork, Trader Joe.
This report analyses the top four liquidity pools for JOE, Trader Joe’s governance and utility token, all of them residing on the Trader Joe DEX. The report will continue to use the Reach, Retention, Revenue framework from Covalent — the investigation has been completed using Increment, Covalent’s querying and charting product.
The pools analysed are as follows:
JOE/WAVAX [$4.8M TVL]
JOE/USDC [$0.7M TVL] (Native USDC)
JOE/USDC.e [$0.5M TVL] (USDC bridged from Ethereum)
JOE/USDT.e [$0.2M TVL] (USDT bridged from Ethereum)
The analysis itself serves to:
Give traders and liquidity providers deeper insight into the pools they utilise
Aid the Trader Joe team in distributing potential future liquidity mining rewards to appropriate pools
Trader Joe claims to be ‘your one-stop-shop for Decentralised Finance’ on Avalanche — having forked Uniswap V2, they continued to expand into all areas of DeFi, dominating Avalanche completely by offering farming, lending, NFTs and a launchpad on top of their standard AMM.
Trader Joe charges a flat rate of 0.3% for all trades on the AMM, where 0.25% is distributed back to the LP of that pair. LP tokens can be further staked and farmed to boost yields — usually from direct rewards in JOE. The other 0.05% of fees is distributed to sJOE (Staked JOE) in the form of USDC. Rewards of all kinds can be further boosted by locking your JOE as veJOE (vote-escrowed) for up to a maximum of 1 year. For more details, visit the V1 docs.
Trader Joe is in the process of releasing their V2 AMM product, Liquidity Book, a concentrated liquidity AMM — learn more in their V2 docs.
Reach
Reach encompasses growing a user base allowing us to evaluate the usage of JOE pools.
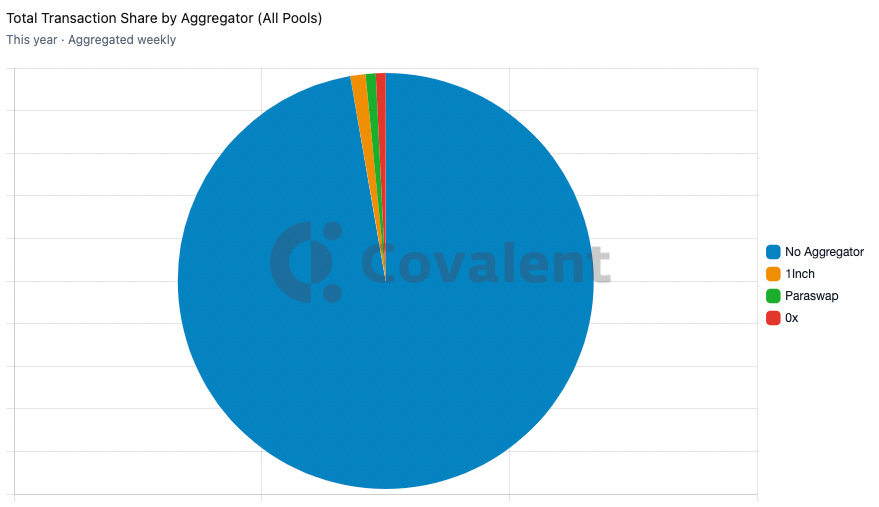
As expected in the current bear market, the number of trades for all pools has steadily declined throughout the year. However, the actual number of traders using the pools has remained relatively steady, with the main decline originating from the JOE/WAVAX pool. A similar story can be told for the number of new traders entering the pool, will although has a slight downtrend, has remained reasonably stable throughout the year. The number of aggregator transactions is fairly negligible, which can be expected on a chain where Trader Joe has such dominance.
Retention
Retention surrounds retaining a user base allowing us to evaluate frequent users of JOE pools.
The three types of charts above show the retention for both LPs (Mint-to-Burn Ratio vs Volatility) as well as for Traders (MoM Trader Retention, Trader Stickiness Ratio).
The Mint-to-Burn Ratio is the ratio between liquidity added to the pool and that removed from it. All of the pools show the same relative behaviour where most weeks have a ratio below 1, with some sporadic weeks above 1. The JOE/WAVAX pool has the most weeks with a high mint than burn. The ratio for deeper liquidity pools (JOE/WAVAX, JOE/USDC) shows a good correlation with price decline throughout the year.
MoM Trader Retention shows the retention rate of traders, grouped by the first month they swapped each pool. In all pools, trader retention is generally strong even out over 6 months showing good retention of users. This is especially true for JOE/USDC, where after 8 months 50% of the traders are still using the pools. The trader stickiness ratio confirms this behaviour as all pools have relatively flat lines, somewhat declining as the bear market continues and more participants exit.
Revenue
Revenue concerns monetising the user base allowing us to evaluate the performance and fit of a product.
Unfortunately, due to a minor bug, TVL is not available to show for the pools — but I can confirm that all pools have had their TVL drastically cut over the year with more than 90% loss in all pools. This is partly due to the poor performance of the JOE token itself. TVL leads to a more efficient trading experience, and as such, the volume of swaps has also been hit hard over the year, with only JOE/WAVAX making any consistent volume above $1M per week.
Looking at Mean Liquidity Added Over Time, this trend is continued, with some strong additions in Q1-Q2, especially for the newly launched JOE/USDC pool, however, the capitulation across the industry in April/May has damaged these pools with no sign of recovery.
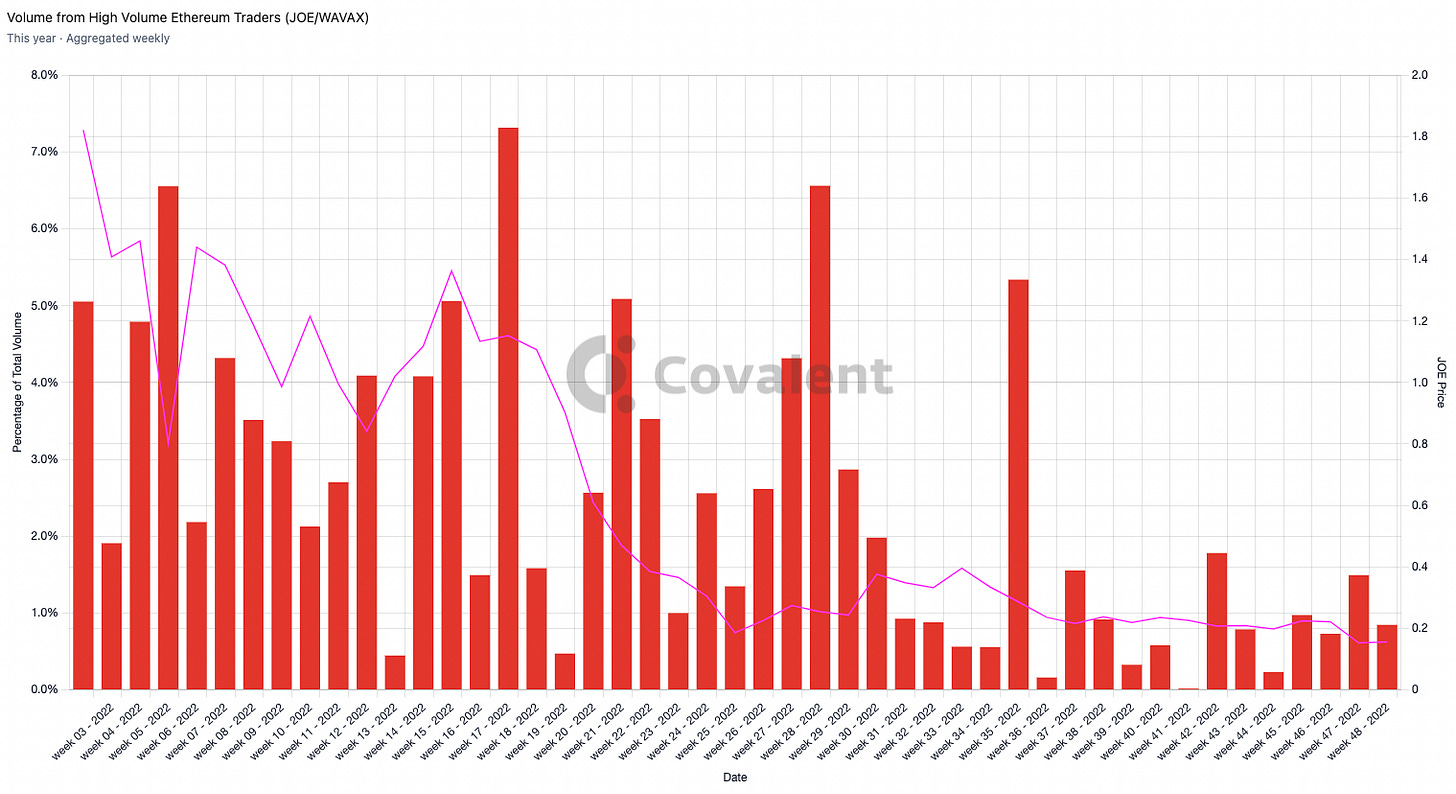
The final group of charts show the percentage of volume from each pool coming from wallets that have transferred over $1M on Ethererum in the last 3 months. This will show us whether these big players in the conventional space of Ethereum are still seeing value in JOE pairs. Unfortunately for JOE, the trend more or less follows price, especially for the JOE/WAVAX pair. What is clear is the relative strength of stable pairs against the WAVAX pair over time as interest seems to be lost in AVAX and people are more focused on transacting with stablecoins, despite their lower liquidity.
Liquidity Mining
If allocated $100,000 in liquidity rewards, I believe the Trader Joe team should focus on the top two pools, JOE/WAVAX and JOE/USDC. As the leading native DEX on Avalanche, it is extremely important to continually support the AVAX token itself and its liquidity on-chain as its survival is directly linked to Trader Joe's. In terms of the stablecoin pools, the native coin, USDC, should be prioritised due to its improvements in security concerns over bridged assets.
It is clear from the above analysis that the JOE-WAVAX pool has much deeper liquidity and activity than the JOE-USDC pool, therefore a suitably higher allocation should be directed to the USDC pool. The goal would be to bring these two pools closer together in terms of liquidity, swap volume and therefore fees. Additionally, it has been visible in the analysis that despite a much lower TVL, the USDC and USDC.e pools have a relatively high share of volume compared to WAVAX. This could be further compounded by encouraging LPs to move from USDC.e to USDC.
Therefore, I would allocate 80% of the rewards to the JOE-USDC pool and 20% to the JOE-WAVAX pool.
For more insight into JOE, check out many other charts on my Increment Page:


